Hardy-Weinberg Spreadsheet Model
As part of the KABT thread at the recent KATS KAMP, I argued that we should be asking our students to use spreadsheets to model the concepts of population genetics–in particular Hardy-Weinberg equilibria. I tried to make the case that most of the efforts to model H-W equilibrium in classroom activities such as the AP Biology H-W lab, the M & M’s labs or with beans suffer from too small of sample size (population) or are tedious for the students to explore. On the other hand, working up your own models or having students create their own can be a challenge. The benefits to learning are worth the challenge. In this post, I’ll present the essential parts of an EXCEL spreadsheet that can be used to explore some of the first principles of the effects of population size on drift. This is not presented as the definitive spreadsheet model but rather a rather simplistic model accessible and modifiable by your students. BTW, it takes longer to read this post than it takes to make this relatively simple spreadsheet. I suggest that you bring up EXCEL or some other spreadsheet in a different window and try to create this worksheet as you follow these instructions. Once you’ve mastered this and can creat or modify it at will, then try it out with your students–they can handle this level of difficulty. And when do, they will have an effective tool to explore the basic principles of H-W equilibrium–one that they created.
Here’s what we are shooting for; the basic spreadsheet model for a 2 allele model:
(I’ve recently reviewed this and found that I didn’t mind my p’s and q’s–sorry for the error but the technique is the same.)
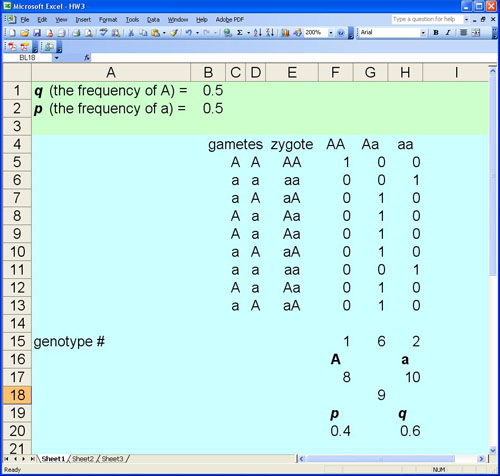
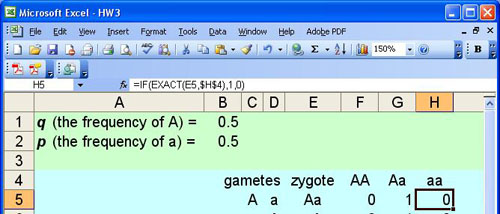
Like other simulations, this first spreadsheet assumes a sexually reproducing species with an infinite gene pool, limited zygotes, random mating, no selection, no mutation, and no migration. The green zone on this spreadsheet represents the gene pool. Note that the value for p is entered in cell”B1″and the value for q is calculated by a formula in cell “C1”.

Enter the label, “gametes” in cell “C4”, the label “zygote” in cell “D4”, the label “AA” in cell “E4, the label “Aa” in cell “F4”, and the label “aa” in cell “H4”
The gene pool is assumed to be infinite and the selection for gametes for the next generation is assumed to be random. To accomplish this in the spreadsheet we call on the RANDOM function. If you were to pick an empty cell on the spreadsheet and enter the following function: =RAND() you’d get a random number returned that was somewhere between 0 and 1. Try it out and see. Our entire model is based on this RANDOM function and unfortunately I’m not sure how random it really is but for our purposes it will work.
In cell “C5” we will generate a random number, compare it to the value of p, and then place either an “A” gamete or an “a” gamete in the cell.
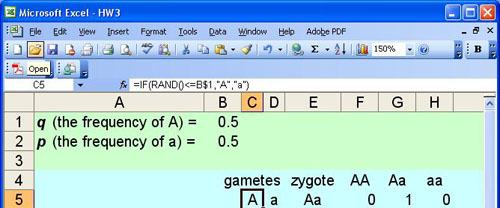
Note that the function that is entered in cell “C5” is: =IF(RAND()<=B$1,”A”,”a”)
Which basically says, if a random number between 0 and 1 is less than or equal to the value of p then put an “A” gamete in this cell or if it is not less than or equal to the value of p put an “a” gamete in this cell. “IF” functions and “RAND” functions are very powerful tools when you try to build models for biology. Now create the same formula in cell “D5”. When you have this completed then press the “F9” key on your windows keyboard to force a recalculation of your spreadsheet. If you have entered the functions correctly in the two cells you should see changing values in the two cells.
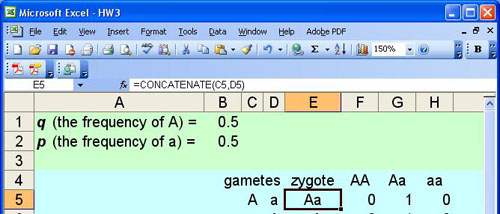
We’ll put the zygotes in cell “E5” . The zygote is a combination of the two randomly selected gametes. In spreadsheet vernacular you want to concantenate the values in the two cells: In cell “E5” enter the function: =CONCANTENATE(C5,D5)
The next columns on the sheet, “F”, “G” and “H” are used for bookkeeping–keeping track of the numbers of each zygote’s genotype. They are rather complex functions that use nested “IF” functions and also the “EXACT” function. The”EXACT” function is required to determine the difference between “A” and “a”. Here goes:
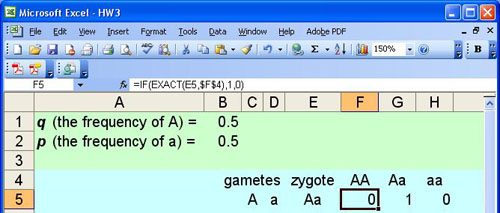
The function in cell “F5” is: =IF(EXACT(E5,$F$4),1,0)
which basically states: if the value in cell “E5” is exactly “AA” then put a 1 in this cell, if not then put a 0.
Enter a very similar function in cell “H5”.
=IF(EXACT(E5,$H$4),1,0)
which basically states: if the value in cell “E5” is exactly “aa” then put a 1 in this cell, if not then put a 0. (Note that the value “aa” is stored in cell “H5”
Now let’s tackle the nested “IF” function. This is needed to test for either “Aa” or “aA”
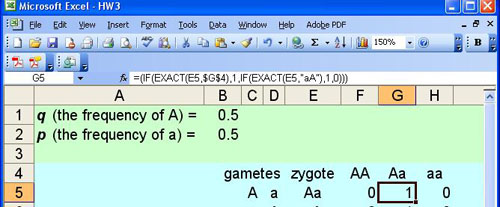
In cell “G5” enter the nested function: =IF(EXACT(E5,$G$4),1,IF(EXACT(E5,”aA”),1,0))
The example in the image has an extra set of parentheses–something that sometimes happens when I’m trying to nest functions. At any rate this function basically says: if the value in cell “”E5” is exactly equal to “Aa” then put a 1; if not then if the value in cell “E5” is exactly “aA” then put a one; if it is neither then put a 0 in this cell….
There you have it. Copy the cells “C5” through “H5” down for as many zygotes as you’d like in the first generation. Sum up the values in the “F”, “G”, and “H” columns to summarize the genotype frequencies in the next generation, make a histogram and you end up with something like this:
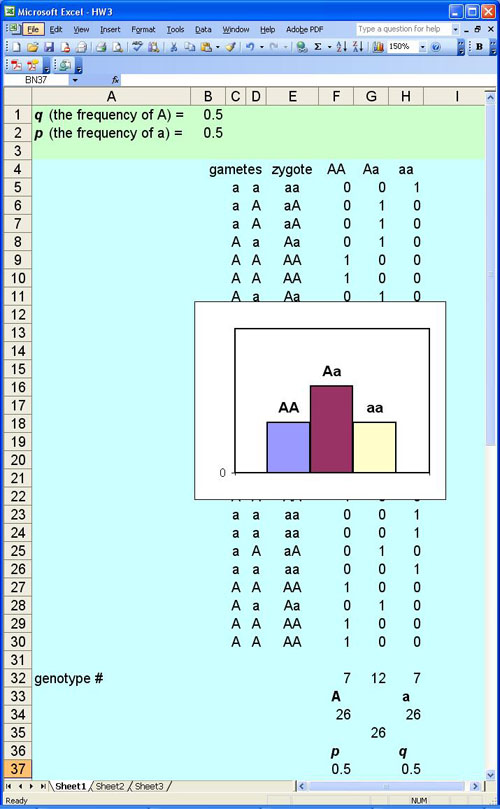
With a model like this you can vary the number of offspring by inserting or deleting rows to investigate the effect the size of the population has on the gene frequencies in the next generation. Those of you with the AP Biology Lab manual can use this spreadsheet to answer the first few questions in the simulation part of the exercise and it should be pretty easy to modify it to answer others. That’s your challenge. Let me know how it works out.
BW

[…] (modified from a post that originally appeared at http://www.KABT.org) […]
[…] spring, at KATS KAMP, I introduced the idea of using student generated spreadsheet models to explore Hardy-Weinberg equilibrium and as a substitute for the H-W simulations described in the […]