In My Classroom #11: Cell Signaling
Welcome to the KABT blog segment, “In My Classroom”. This is a segment that will post about every two weeks from a different member. In 250 words or less, share one thing that you are currently doing in your classroom. That’s it. Here we go:
[Use the links… they’re helpful]
Cell Signaling.
How does something so awesomely complex get such an innocuous name? The science behind how our cells communicate within and between their cell membranes was something that either I had never been taught (or blocked from my memory… sorry Mr. Kessler), but when I first started teaching College and AP Biology, I had to quickly get myself up to speed on. The underlying principle (like is true with any complex biochemical reaction series it seems) is actually fairly simple.
A signal is received. The message is passed from one messenger to the next. Eventually the message is received and a response occurs.
We can read about, model, diagram, memorize, write about, ponder upon, and generally learn about cell signaling in a number of “traditional” ways. But how do you experiment with it? And how can it be open (or even guided) inquiry?
Here’s what we try: Tastebud Transduction Lab
We start by reading and annotating an article, “Matters of Taste” from The Scientist on how our tastebuds are able to differentiate between all the different flavors we take in on a daily basis. I really like the detail they go into without losing their audience. [I have an edited version for 9th graders if you’re interested].
After a discussion in class, and a “Guided Reading” to reinforce the information from class, we begin our test by generating a list of things we think correlate to taste bud density, but that might not be directly related. For example, are “supertasters” pickier eaters? Students then design and conduct an experiment that looks for relationships between taste bud density and their chosen dependent variable.
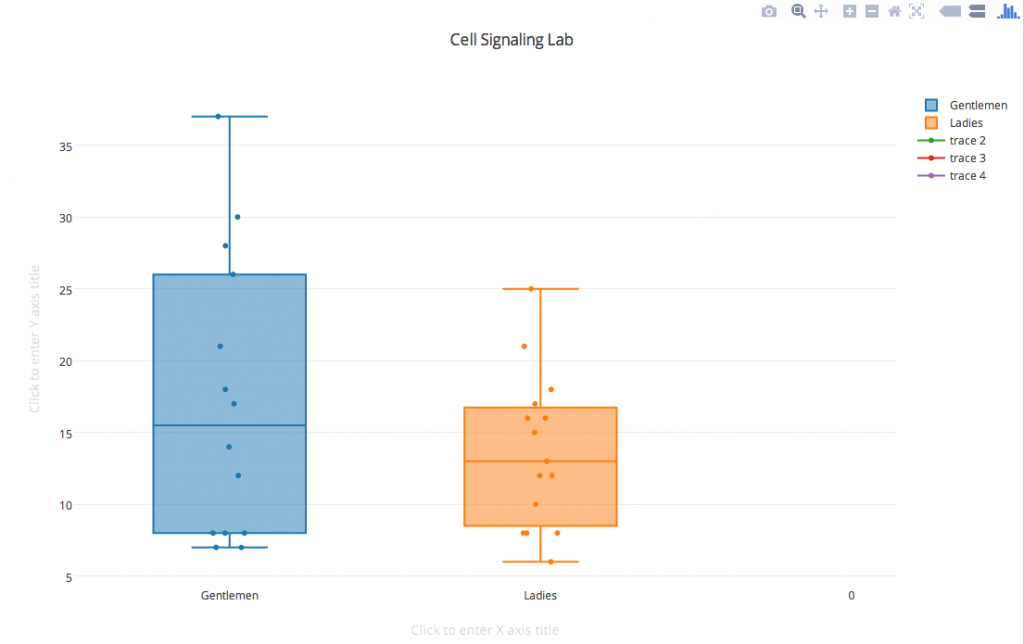
Since it is so difficult to actual observe and manipulate these taste signaling pathways, I like to use this lab as a lesson in statistics, correlations, and significance. Students use a graphing program (plot.ly— it is AWESOME) to make a plot, then we get to talk about what R² really means, how correlation doesn’t imply causation, standard curves and outliers, and generally why stats are useful tools in research but can mislead even very intelligent, careful scientists.
I’m out of words (actually way over), but if you want to know more, email me (andrewising@gmail.com), comment here, or tweet me (@Mr_Ising or @ksbioteachers). One day Michael Ralph and I will get around to creating a bunch of “stats for science class” resources, but if there is interest here, it might give us a little more motivation to start earlier. Good luck, Jessica Otradovec Popescu, because you’re on the clock!

 Next Post
Thanks for sharing Drew